Back to the diary
|
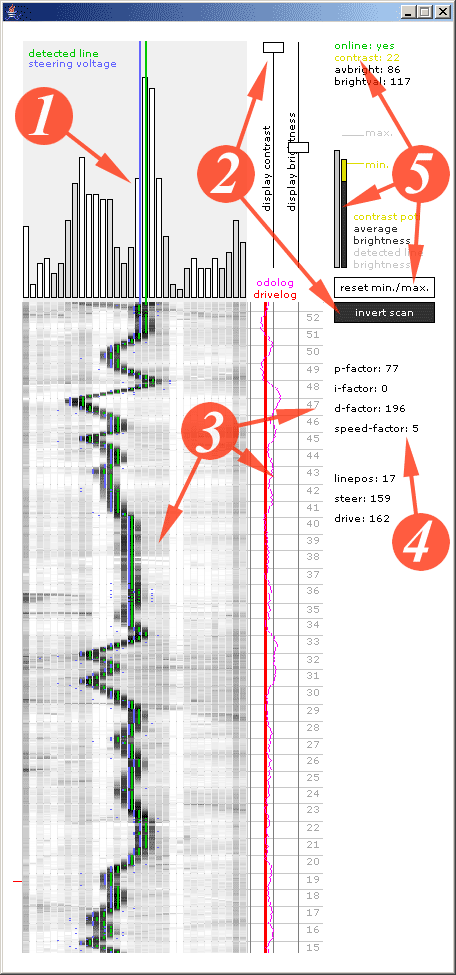
The screen shot below shows the functions of GDdoctor Pro V0.9. To download the processing code, please click here. (Please note, that this program only works, if you have connected your PC with your wheelchair - and it only works with the latest Bascom code on the wheelchair!)
1: The bar graphs show the current values, which are provided by the 32 LDR's. The blue line shows the steering voltage, which goes to the wheelchair driver, the green line is what the controller detects as line position.
2: Those faders adjust the visual appearance of the bars. There is no feedback to the wheelchair. These sliders only help to get a better view on what the wheelchair sees. The invert scan-button lets you switch the brightness of the recorded image(3). This can help, if the blue or green line are bad to see on the scanned background.
3: The scanned values are recorded and displayed on this down scrolling part as gray values. The red line next to it on the right side, records the driving voltage - the magenta line records the odometer values. Next to it, the numbers mark the passing time in seconds.
4: Those are the actual poti values of the Service Control Unit. Below, you can see the values for "linepos" (the controller detected the line under this sensor), "steer" (this value goes out to the DAC to generate the steering voltage) and for "drive" (the same as steer, but for the driving voltage).
5: This part of the program makes the GDdoctor even more Pro! This really helps to adjust the contrast poti for the out of line detection. The gray bar on the left shows the brightness of the sensor, under which the controller detected the line. The darker bar right next to it shows the average brightness of the other sensors. While the drivecontrol code compares the difference between these both values with the contrast poti adjustment, I've set the contrast poti value as yellow bar on top of the dark gray bar. As soon as the right bars go higher than the left bar, the controller recognizes a lost of track situation. What also helps a lot to adjust this poti, are the "min" and "max", which are displayed next to it on the right. Those both values are stored all the time during your test drive and show the minimum contrast between average and detected brightness and maximum contrast. You should adjust the contrast poti, that the top of the yellow bar is slightly under the min. line. You can also reset the recorded min and max values with the reset-button. Well, this explanation might not have been the best, but this is something which explains itself much easier, when you're actually adjusting it. |

