|
|
||
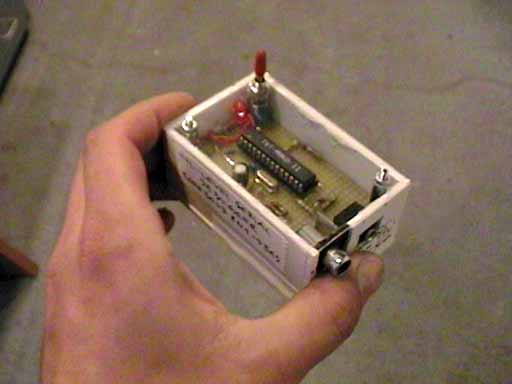
| Back to the diary | To debug my drive control program, I used this very nice TV-MBKD-11 terminal controller. It is an Atmega 8 with a firmware of Axel Viebig on it. It has a serial TTL-level input and a BAS-video output. With that, you can either display text on a video monitor, or you can let it run in a graphic mode, which can display up to 36 bar graphs in real time. This is perfect, if you want to know what the variables in the program are doing. I have connected the BAS-output to my DV-camera, so I can see the bar graphs on the display, while I am driving around. |
|
|
||
Here is an image, that I recorded during the last test run. The different information in the picture mean the following: 1: LP: Line position - This is the number of the sensor, which is directly above the adhesive tape. 2: A: Average brightness value of all sensors, except the sensor which is above the tape and the sensors next to it on the left and on the right. 3: B: Brightness value of the sensor, which is directly on top of the tape. The sensors are counted from the right. 4: C: Contrast (error level) poti. If the difference between 3 (brightness) and 2 (average brightness) is lower than this contrast value, the controller expects, that the wheelchair has lost the track and stops immediately. It also sets the alert-output to high: A visual and a sonic alert will happen. 5: "Line scan Debug Mode" is the present mode. The other two modes of the controller are the "Adjust White Level" and the "Adjust Black Level" modes to calibrate the sensor array. 6: Each of the 32 bar graphs (from the left) are showing the brightness value of one LDR. The controller detects the position of the adhesive tape, where the peak is. 7: This is a reference bar graph, which stays always at 50%. This visual reference is useful to interpret the bar graph values next to it on the right. 8: This barograph shows the steering value, which is transmitted from the controller to the motor driver. If its value is higher than 50%, the wheelchair drives to the right, if it is lower than 50%, it steers to the left. 9: This is the driving speed, which is transmitted to the motor driver. At the moment, this is directly adjusted by the "Speed"-poti. Later, there will be a PID-control for this. 10: The current speed, measured with the odometer is indicated with this bar graph. |
||
|
||
Please note, that the content on this webpage is licensed under a Creative Commons Attribution 2.0 License. Please respect the copyright of other webpages' content, which are linked from this webpage. |
||